Case Study

Responsive Data Tables

Defining enterprise design standards for complex user interface controls.

Over 92% of polled users stated that they expect access to the same data, features, and functions on mobile devices as they do on desktops.

Responsive Web
Example of a Summary table class
Example of a Complex table class
Example of a Simple table class

Situation

This work was part of AT&T’s DS2 enterprise design standards initiative. The DS2 effort involved the reimagining everything from typography to atomic UI patterns and mashups across the board.

Challenge

A basic table pattern had already been designed prior to my involvement but was incomplete.

My challenge was to conduct a deep dive audit across B2B and B2C experiences and propose additional visual and interactive designs and responsive architecture solutions that addressed user pain points and expectations to complete this pattern’s specification.

Approach

The stakeholder elected to take an Unintentional / Activity Design approach. I relied on the feedback and input from 2 internal B2B customer support agents and a member from the B2B Accounts Receivables team.

Outcomes

After several rounds of iterations, I was able to provide both interactive and visual design standards that were adopted into AT&T’s next generation DS2 enterprise design system and used as a source of truth. My table design work helped reduce B2B accounting errors and decreased time-on-task for several key, repetitive internal B2B accounting workflows.

User Empathy and current state Audits
An audit of both B2B and B2C funnels exposed a varying degree of table patterns and the content being exposed within them. During the audit, I sat with 3 internal customer care agents and 1 business customer to better empathize with needs, expectations and pain points.
Findings
The interviews and audits resulted in the identification and classification of three predominate table patterns supporting B2B and B2C digital experiences.
Table Classification 1
Simple
Findings: Tables classified as Simple will flex elegantly across breakpoints (or simply fit as-is within the smallest 320px viewport). Viewing the content of a Simple table type does not require any additional user involvement (pinching, zooming, scrolling, etc.).
Table Classification 2
Complex
Findings: Tables classified as Complex are Simple tables but with one key difference. Complex tables possess so much content that the table, in its complete form, can not fit elegantly within the smallest 320px viewport. Column data is simply too dense to fit comfortably without the need for additional user interaction (pinching, zooming, scrolling, etc.).
Table Classification 3
Summary
Findings: Summary tables are essentially a hybrid of the Simple and Complex table types. However, a Summary table displays only (and always) 2 columns across all breakpoints. The Summary table type is preferred when presenting content in an accounting or ledger style format.
Best Practice Research
Before rushing into future state design iterations, I wanted to freshen up on my knowledge of tables from the perspectives of component architecture and cognitive science. I used the W3C as a source of truth for component architecture and (primarily) Edward Tufte for the cognitive and content design research.
Critical Thinking & Brainstorming
Annotations
Before & After
Before & After
Delivered
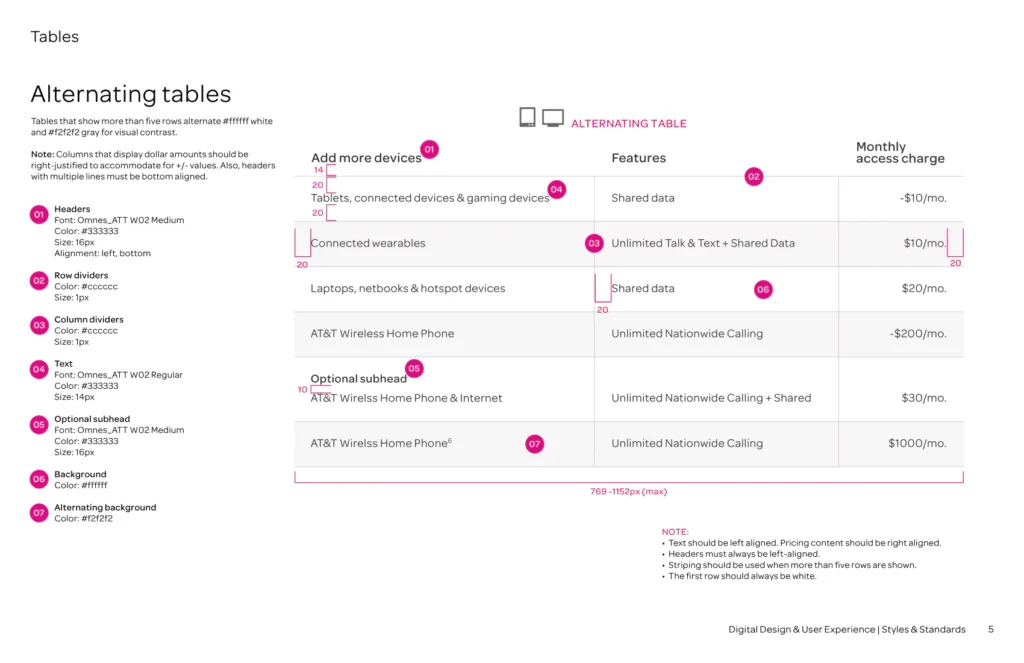
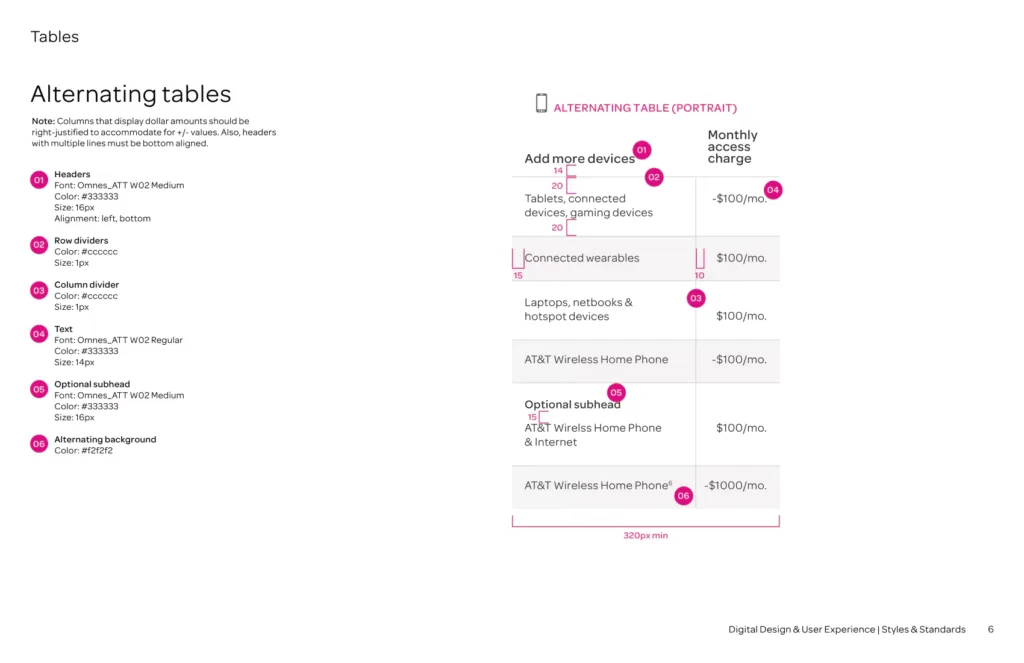
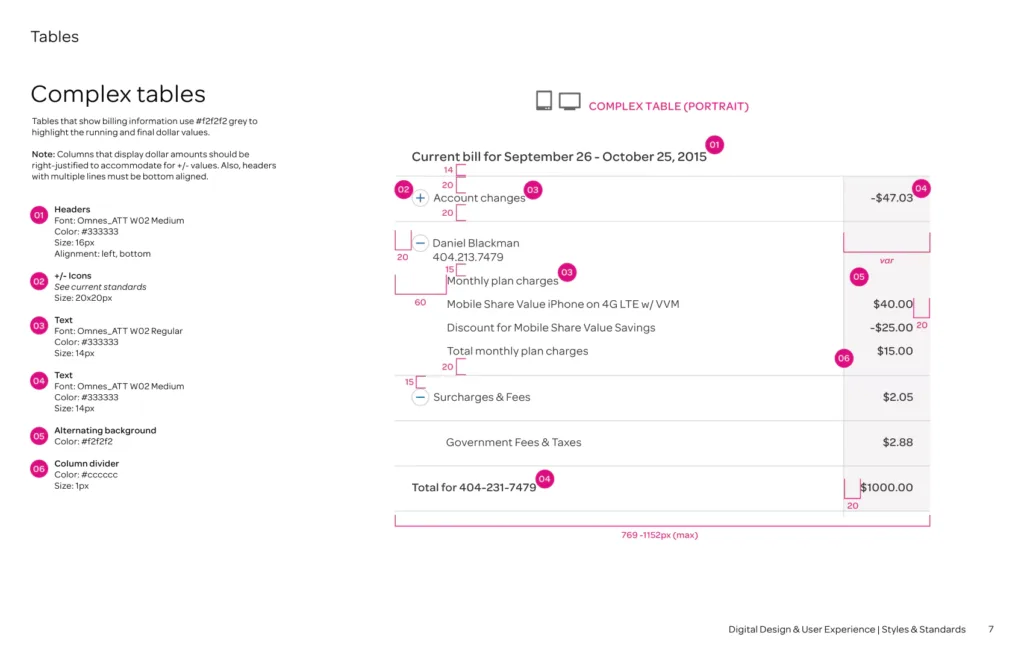
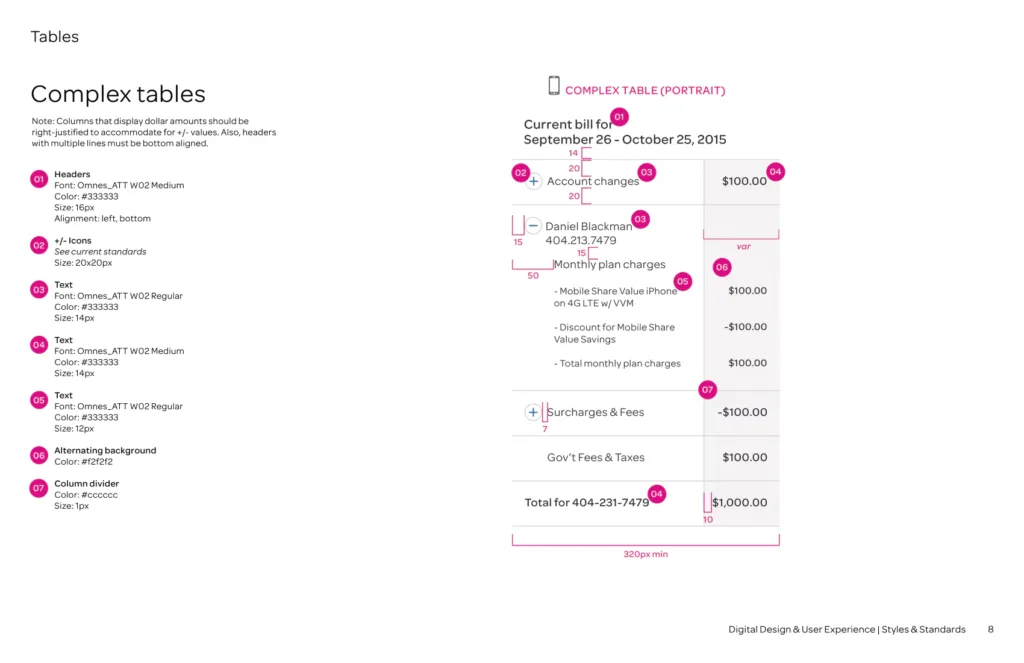
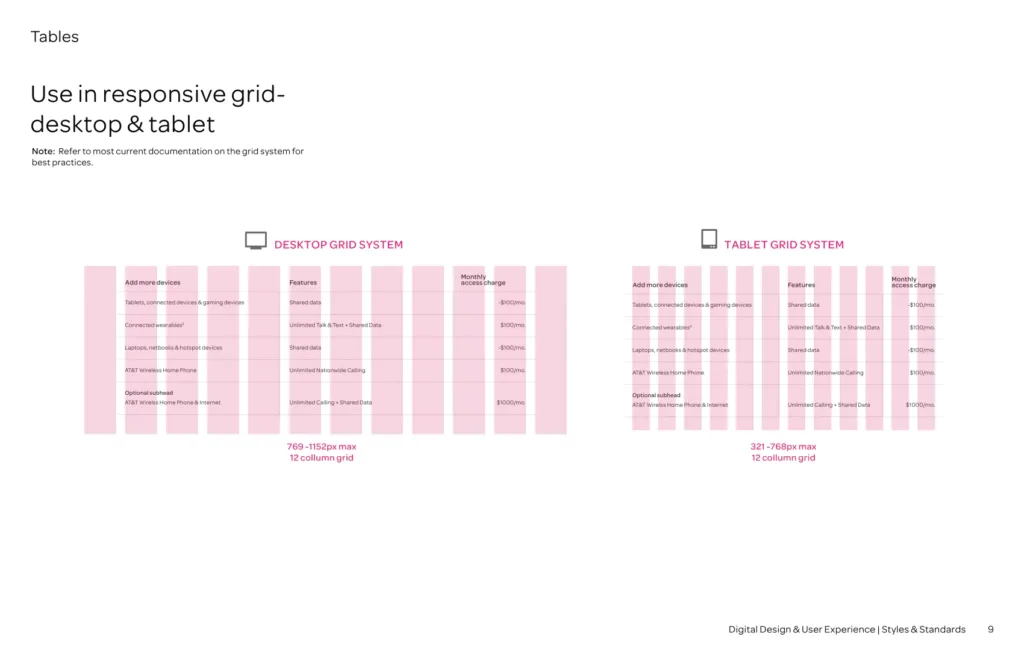
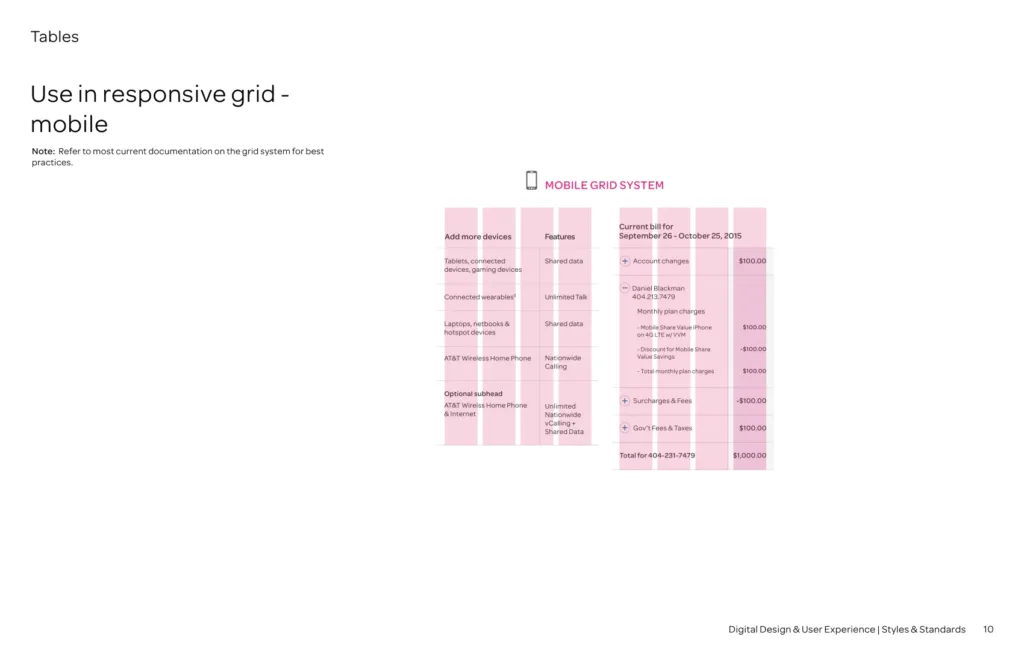
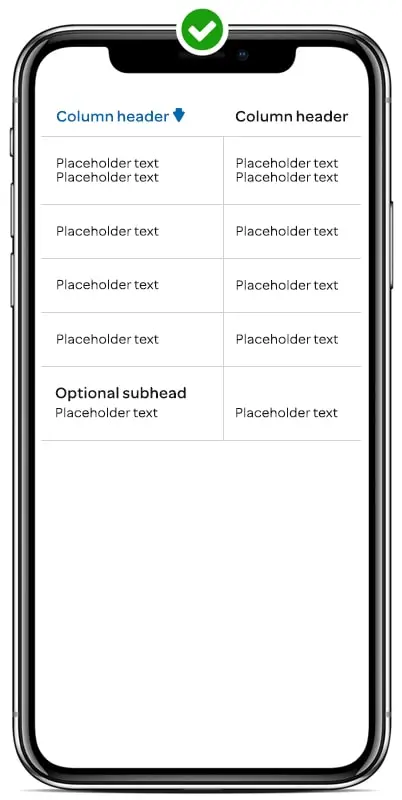
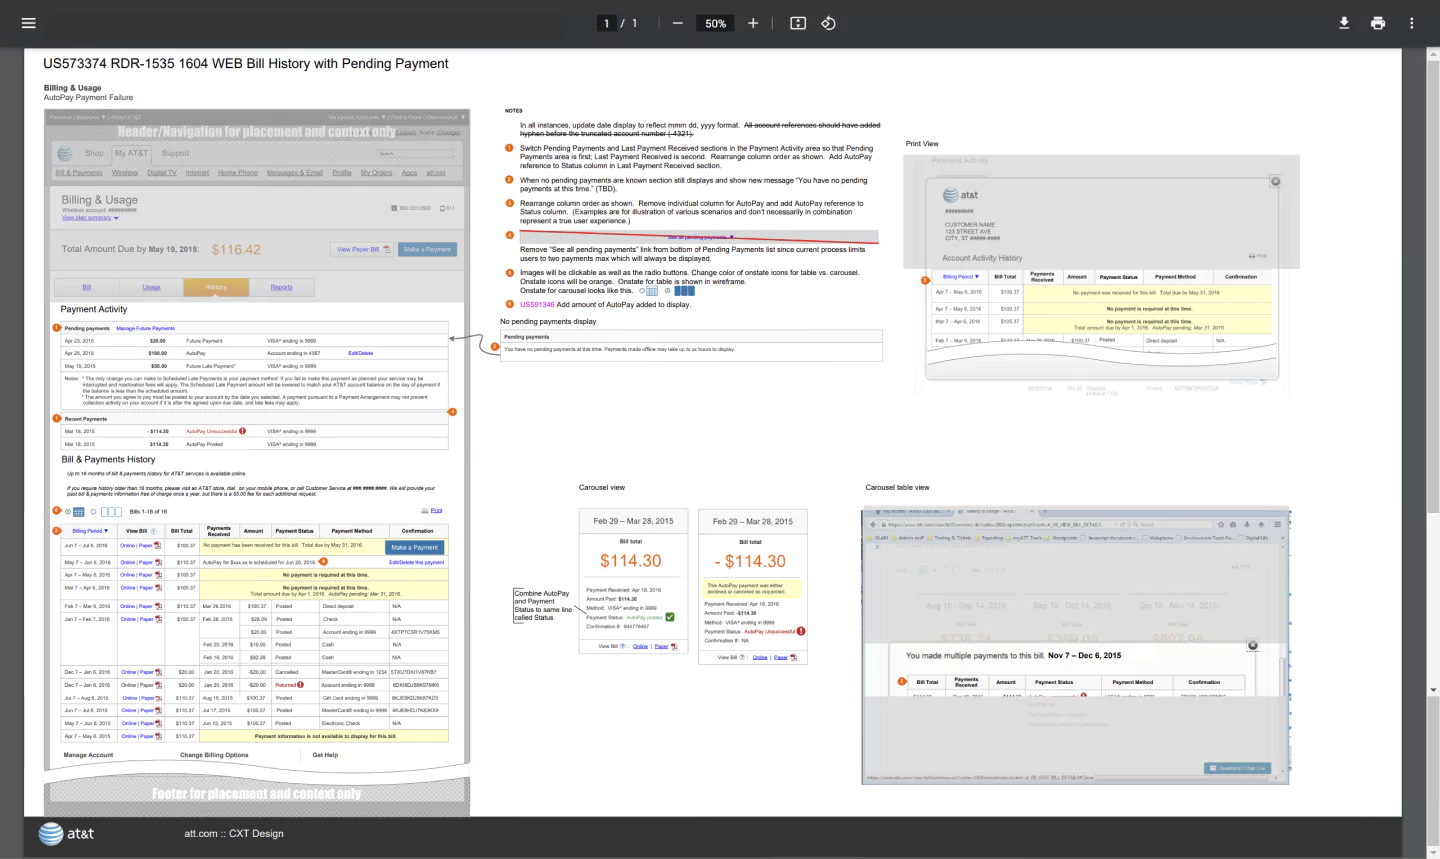
Enterprise Design Standards
My design leadership resulted in the formation of visual and interactive design standards that informed B2B and B2C enterprise engagements across AT&T improving millions of monthly Web visits.
Testimonial

“We have taken your design recommendations and leveraged them to create an amazing solution for our business partners and they are all overjoyed. We understand that it is a draft and you will be doing some testing, but it has been a great springboard for us and wanted to let you know how much we appreciate you saving the day!”
Melinda B. — B2B Product Owner